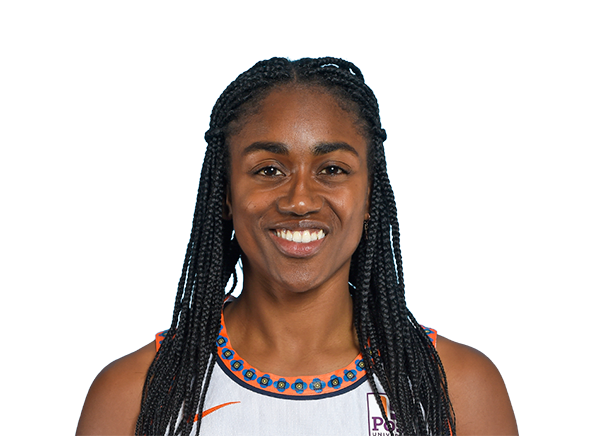
Golden State Valkyries · 53 games
Tiffany Hayes
Next-game projection
Recency-weighted, adjusted for the next opponent's pace and defense. A model estimate, not a guarantee.
Shot chart
Loading shots…
Field-goal attempts this season, both baskets folded to one half court. Descriptive, not a projection.
Isolated rankings
Impact (RAPM)
Scoring
Efficiency
Playmaking
Rebounding
Defense
Discipline
Impact trend · RAPM by season
Percentile rank vs. all 229 qualified WNBA players this season, pace-adjusted. Impact (RAPM) measures on-court scoring margin per 100 possessions, teammate- and opponent-adjusted over recent seasons; each trend point is a trailing multi-season blend, so it reads as a trajectory rather than noisy single-season on/off. Descriptive stats, not a projection.
Game log
| Date | Opp | MIN | PTS | REB | AST | STL | BLK | FG | 3P |
|---|---|---|---|---|---|---|---|---|---|
| Oct 26 | vs ATL | 30 | 12 | 3 | 2 | 2 | 0 | 4-9 | 0-3 |
| Oct 24 | @ ATL | 25 | 13 | 5 | 0 | 0 | 0 | 5-10 | 0-2 |
| Oct 21 | @ ATL | 24 | 14 | 3 | 1 | 0 | 0 | 6-13 | 1-4 |
| Oct 19 | vs ATL | 25 | 14 | 2 | 3 | 1 | 0 | 5-11 | 0-3 |
| Oct 17 | vs ATL | 24 | 3 | 6 | 4 | 1 | 1 | 1-12 | 1-5 |
| Oct 9 | @ LV | 22 | 11 | 6 | 4 | 2 | 0 | 4-14 | 1-5 |
| Oct 7 | vs LV | 17 | 21 | 2 | 2 | 2 | 0 | 6-10 | 1-2 |
| Oct 4 | vs LV | 11 | 3 | 1 | 0 | 1 | 0 | 1-4 | 0-2 |
| Oct 2 | vs DAL | 27 | 18 | 4 | 2 | 1 | 1 | 6-17 | 2-5 |
| Sep 30 | @ DAL | 15 | 6 | 3 | 2 | 0 | 0 | 1-3 | 0-0 |
| Sep 27 | vs DAL | 19 | 21 | 1 | 4 | 2 | 0 | 7-10 | 3-5 |
| Sep 24 | @ LA | 12 | 6 | 1 | 0 | 0 | 1 | 2-6 | 0-1 |
| Sep 22 | @ POR | 26 | 10 | 0 | 3 | 0 | 1 | 3-10 | 1-5 |
| Sep 19 | vs SEA | 19 | 10 | 2 | 6 | 0 | 0 | 4-5 | 1-2 |
| Sep 18 | vs POR | 25 | 13 | 3 | 7 | 2 | 0 | 6-14 | 0-4 |
| Aug 30 | @ POR | 21 | 18 | 6 | 3 | 2 | 0 | 7-12 | 2-5 |
| Aug 27 | @ NY | 13 | 12 | 2 | 0 | 0 | 1 | 3-5 | 1-2 |
| Aug 26 | @ CONN | 3 | 5 | 0 | 0 | 2 | 0 | 2-3 | 1-1 |
| Aug 24 | @ MIN | 18 | 14 | 3 | 4 | 1 | 0 | 5-8 | 2-3 |
| Aug 21 | @ CHI | 30 | 10 | 7 | 4 | 1 | 0 | 3-10 | 0-2 |
| Aug 19 | vs MIN | 25 | 12 | 7 | 2 | 1 | 2 | 5-12 | 0-5 |
| Aug 17 | vs DAL | 20 | 10 | 4 | 1 | 1 | 0 | 4-11 | 2-5 |
| Aug 12 | vs CHI | 17 | 22 | 6 | 5 | 3 | 1 | 8-11 | 1-2 |
| Aug 9 | @ LA | 19 | 14 | 3 | 2 | 0 | 0 | 5-8 | 2-3 |
| Aug 7 | @ DAL | 12 | 9 | 1 | 2 | 1 | 0 | 1-2 | 0-0 |
| Aug 4 | vs TOR | 24 | 12 | 4 | 4 | 4 | 0 | 4-11 | 0-3 |
| Aug 2 | vs TOR | 20 | 15 | 3 | 4 | 3 | 0 | 4-10 | 1-5 |
| Jul 29 | @ PHX | 23 | 11 | 3 | 5 | 0 | 0 | 4-12 | 0-5 |
| Jul 20 | vs WSH | 10 | 0 | 0 | 2 | 0 | 0 | 0-2 | 0-0 |
| Jul 18 | vs WSH | 12 | 7 | 1 | 1 | 0 | 0 | 2-3 | 1-2 |
| Jul 15 | @ IND | 22 | 13 | 2 | 2 | 0 | 0 | 3-4 | 0-0 |
| Jul 10 | @ CONN | 17 | 9 | 0 | 5 | 0 | 0 | 3-3 | 0-0 |
| Jul 8 | @ TOR | 19 | 2 | 0 | 3 | 1 | 1 | 0-3 | 0-3 |
| Jul 6 | @ WSH | 19 | 9 | 2 | 2 | 0 | 1 | 4-7 | 1-3 |
| Jul 4 | @ ATL | 13 | 5 | 0 | 1 | 2 | 0 | 2-7 | 1-2 |
| Jun 28 | vs NY | 18 | 8 | 1 | 2 | 2 | 0 | 3-8 | 2-5 |
| Jun 26 | vs ATL | 22 | 12 | 2 | 5 | 0 | 1 | 4-6 | 0-0 |
| Jun 24 | vs ATL | 18 | 0 | 1 | 0 | 0 | 1 | 0-3 | 0-1 |
| Jun 21 | @ LV | 19 | 7 | 1 | 1 | 0 | 0 | 3-8 | 0-3 |
| Jun 19 | vs MIN | 7 | 2 | 1 | 3 | 0 | 0 | 0-2 | 0-0 |
| Jun 17 | vs DAL | 10 | 10 | 0 | 1 | 0 | 0 | 3-4 | 2-2 |
| Jun 15 | vs LA | 10 | 4 | 0 | 2 | 1 | 0 | 1-4 | 0-1 |
| Jun 12 | @ SEA | 24 | 17 | 4 | 3 | 0 | 0 | 5-9 | 0-2 |
| Jun 9 | vs PHX | 13 | 7 | 1 | 3 | 0 | 0 | 2-3 | 0-1 |
| Jun 6 | @ LV | 16 | 5 | 3 | 3 | 1 | 0 | 2-7 | 1-3 |
| Jun 4 | @ MIN | 25 | 15 | 5 | 3 | 1 | 0 | 6-9 | 1-1 |
| Jun 2 | vs POR | 13 | 1 | 0 | 4 | 1 | 0 | 0-0 | 0-0 |
| May 31 | vs LV | 14 | 5 | 0 | 1 | 1 | 0 | 1-4 | 0-1 |
| May 28 | vs IND | 5 | 0 | 1 | 0 | 0 | 0 | 0-0 | 0-0 |
| May 25 | vs CONN | 17 | 9 | 2 | 3 | 0 | 0 | 3-7 | 0-2 |
| May 22 | @ IND | 26 | 19 | 2 | 2 | 1 | 0 | 7-13 | 2-2 |
| May 21 | @ NY | 14 | 9 | 1 | 2 | 0 | 0 | 2-7 | 1-4 |
| May 8 | @ SEA | 4 | 1 | 0 | 1 | 0 | 0 | 0-1 | 0-1 |
Model output · updated October 27, 2026